Solar + Storage Cleans Up in 2023
Current crop of solar projects culminates with two more PSCW approvals, totaling 1,300 megawatts for the year
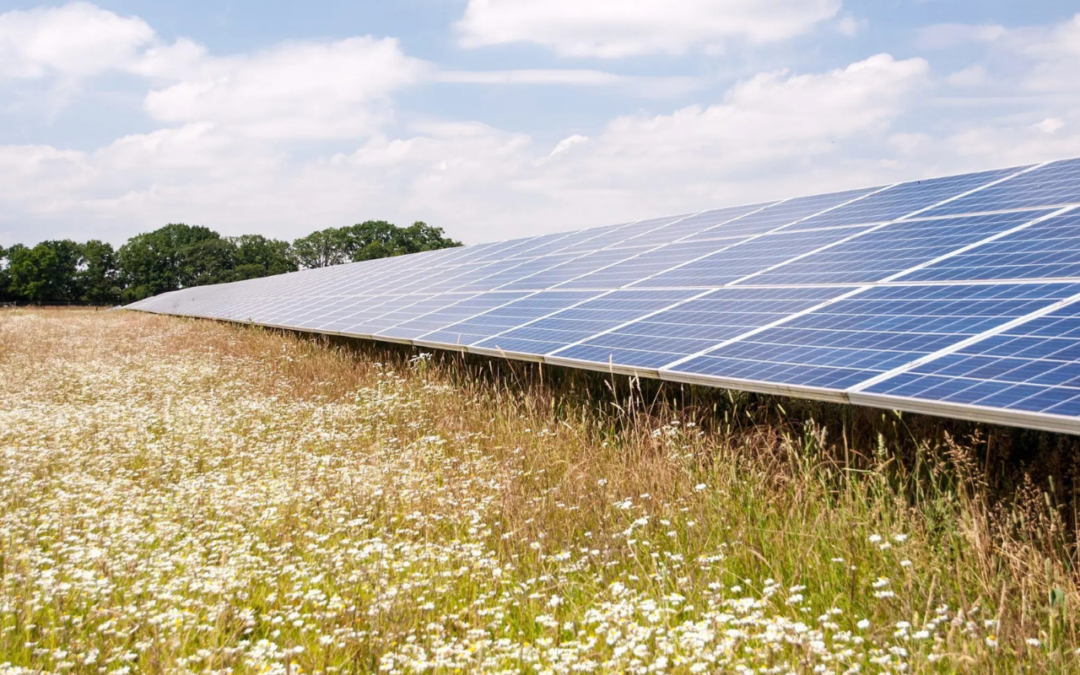
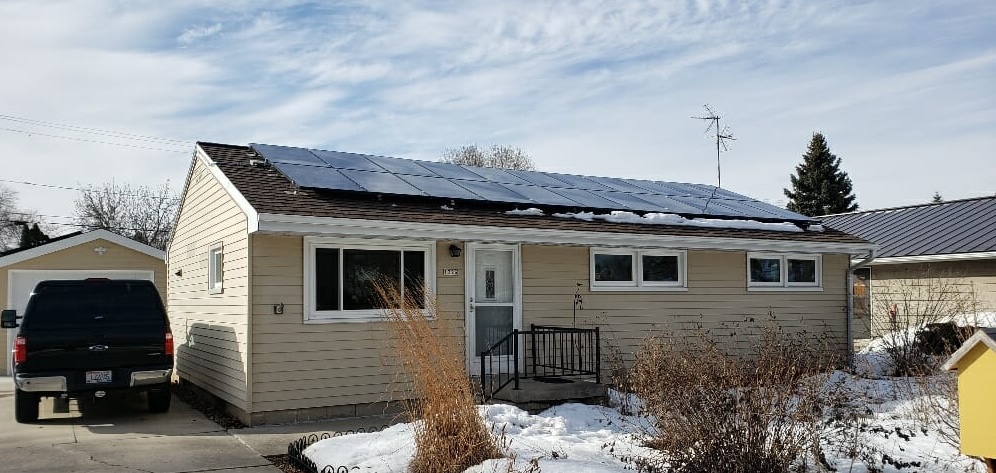
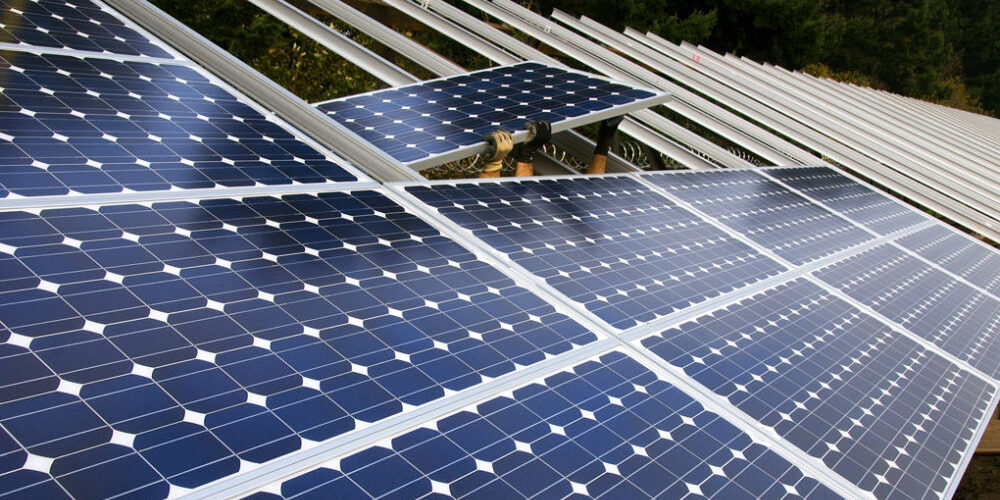
Wisconsin’s transition to zero-emission power plants continues to pick up speed. This year alone the Public Service Commission of Wisconsin (PSCW) issued construction permits for six large-scale solar power projects (see Table 1 below).
With the recent approvals of Elk Creek in Dunn County and Langdon Mills in Columbia County, this year’s crop of PSCW-approved solar power projects will clock in at 1,300 megawatts (MW), the largest annual increase of solar power to date. For comparison purposes, the PSCW approved 614 MW of new solar generating capacity in 2022 and 1,125 MW in 2021.
2023 Solar Power Plants Approved by PSCW
Project Name | Docket Number* | County of Location | Developer | Generation Capacity | Battery Storage (in MW + MWh) |
---|---|---|---|---|---|
Portage | 9810-CE-100 | Portage | National Grid | 250 | 137.5/550 |
Saratoga | 9816-CE-100 | Wood | Savion | 150 | 52.5/210 |
Northern Prairie | 9815-CE-100 | St. Croix | Leeward | 150 | 0/0 |
High Noon | 9814-CE-100 | Columbia | Invenergy | 300 | 165/660 |
Elk Creek | 9819-CE-100 | Dunn | Tyr Energy | 300 | 76.5/300 |
Langdon Mills | 9818-CE-100 | Columbia | Ursa (Samsung) | 200 | 50/200 |
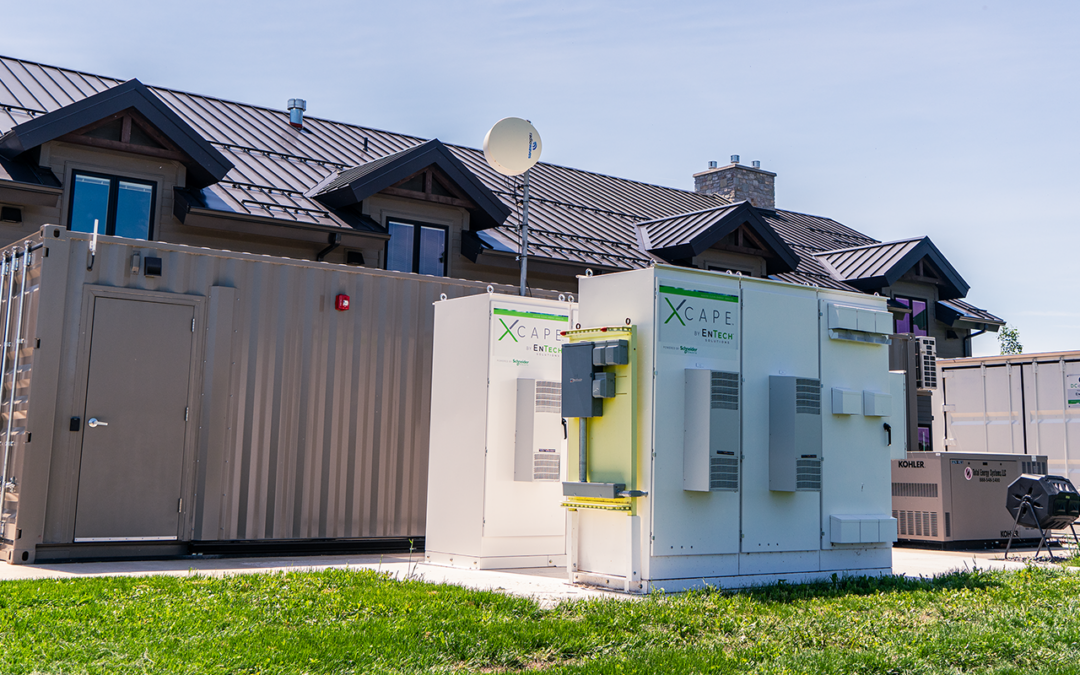
Five of the six approved projects this year will incorporate battery energy storage systems (BESS), with a combined total of approximately 480 MW. Onsite storage enhances the solar output by storing excess production that occurs in the morning or early afternoon for use later that day. With the capability of providing grid support after sundown, combining solar power with storage capacity will reduce the need for generation from other utility sources during late afternoon peak periods.
By themselves, the Class of 2023 solar projects can generate between 2.5 and 2.6 million megawatt-hours (MWh) annually, which would equate to about 3.5% of electricity sales today. These projects, when placed in service, will usher in a wide variety of tangible benefits to host communities, utility ratepayers, and the state as a whole. In all six proceedings before the PSCW, RENEW submitted testimony advocating for their approval and describing how each project would further progress in reducing the electric power industry’s carbon footprint. This is in addition to diversifying the utilities’ energy generation fleet with in-state renewable energy resources.
Environmental Benefits
The core of RENEW’s testimony involved documenting how each of these proposed projects would reduce greenhouse gas emissions from the power sector and bring the state closer to achieving its carbon reduction goals. In 2022, electric power providers in Wisconsin discharged an average of 1,185 pounds of carbon dioxide for every megawatt-hour (MWh) generated, a higher emissions rate than those of neighboring states (see Table 2).
State Power Sector Emission Rates in 2022
State | Lbs./MWh |
---|---|
Illinois | 639 |
Iowa | 789 |
Michigan | 1,096 |
Minnesota | 833 |
Wisconsin | 1,185 |
Source: Energy Information Administration, State Electricity Profiles, 2022
Unlike coal plants and gas turbines, solar arrays do not produce any emissions or wastes while generating electricity. For the foreseeable future, each new solar plant should displace fossil-fueled generation during the day, which will measurably reduce the volume of airborne pollutants and greenhouse gases discharged by Wisconsin utilities.
As the PSCW observed in the Langdon Mills case, “renewable generation projects such as this one promote public health and welfare by generally avoiding most of the impacts created by other types of electricity generation.” The final decision in that proceeding cited a host of positive environmental attributes stemming from solar projects on agricultural land, including “improving air and water quality, reducing agricultural nutrient runoff, enhanced plant and wildlife habitat, and more soil carbon sequestration.”
These projects, it should be remembered, do not represent a permanent conversion of farmland to another land use. Both the PSCW and project stakeholders expect the facilities to be decommissioned after operating for 35 years or so, and the land underneath them to revert to agricultural use.
Economic Benefits
The approved applications describe how the economic impacts from the solar investments would flow to the rural communities hosting these facilities. Typically, the construction phase creates demand for engineering operators, carpenters, delivery drivers, and other trades and crafts. Each new project creates job opportunities for local tradespeople and subcontractors, with the construction process lasting from 12 to 24 months. During construction, the income reaped by the project workforce is recirculated through nearby businesses such as restaurants, motels, and entertainment venues, recharging the local economy in the process.
Once a solar power plant begins generating electricity, it becomes subject to a gross receipts tax, which is shared with the townships and counties hosting the facility. Once the Class of 2023 plants are fully built and placed in service, they will pump $5.2 million into local government coffers each year they remain operational.
Long-term economic benefits can take other forms besides tax revenues. For example, the Saratoga solar project would occupy land currently planted with stands of red pine trees. Due to the ongoing contraction of the pulp and paper industry in central Wisconsin, the market value of red pine growing stock has diminished substantially. Given that economic reality, one can expect landowners with large parcels to decouple their properties from the forest products industry and repurpose them for other uses, such as generating electricity from large-scale solar projects. As we concluded in our testimony, “both Wood County and the Town of Saratoga stand to benefit from a more diversified economic base, a benefit that power projects such as Saratoga Solar bring to the table.”
Project Pipeline is Close to Full
While construction can now begin on the Class of 2023 projects, Wisconsin electricity providers have not yet committed to incorporating any of them in their supply plans. Right now, there is a substantial cohort of solar projects working their way through the construction pipeline, totaling 1,439 MW (see Table 3). Project owners are working with their contractors to ensure that the majority of workers building these projects are Wisconsin residents. Given the very high demand for locally available equipment operators and skilled tradespeople, it is unlikely that we’ll see ground broken on any of the Class of 2023 projects until the projects under construction today are placed in service.
Utility-Scale Solar Power Projects Under Construction
Project Name | County of Location | Electric Utility | Anticipated Start Date | Generation Capacity (in MW) |
---|---|---|---|---|
Crawfish River | Jefferson | Allaint-WPL | 4Q2023 | 75 |
Onion River | Sheboygan | Alliant-WPL | 4Q2023 | 150 |
Springfield | Dodge | Alliant-WPL | 4Q2023 | 100 |
Albany | Green | Allaint-WPL | 4Q2023 | 50 |
Paddock | Rock | Allaint-WPL | 4Q2023 | 65 |
Wautoma | Waushara | Allaint-WPL | 4Q2023 | 99 |
Beaver Dam | Dodge | Allaint-WPL | 4Q2023 | 50 |
Cassville | Grant | Allaint-WPL | 1Q2024 | 50 |
Badger Hollow 2 | Iowa | WEC Energy/ MGE | 1Q2024 | 150 |
Grant County | Grant | Alliant-WPL | 2Q2024 | 200 |
Paris | Kenosha | WEC Energy/ MGE | 4Q2024 | 200 |
Darien | Walworth, Rock | WEC Energy/ MGE | 4Q2024 | 250 |
Total | 1,439 MW |
Source: Public Service Commission of Wisconsin
When the construction underway wraps up, output from Wisconsin’s solar power sector should triple between November 2023 and January 2026. In that 26-month window, the number of working plants will rise from six to 18, and the combined generating capacity will increase from 650 MW today to 2,089 MW by then (see Table 4).
Between now and July 2024, construction crews should complete work on Alliant Energy’s gigawatt-plus fleet of solar power projects. While three of Alliant’s 12 solar plants are operating today, the utility expects seven of the remaining nine units to go live between now and January 1, 2024. Most of the skilled laborers putting the finishing touches on Alliant’s remaining solar power plants are Wisconsin residents and belong to a union.
Annual additions of Utility-Scale
Year | Utility-Scale Solar Generation Capacity Added (in MW) | Cumulative Total (in MW) | Output as a Percentage of Annual State Electricity Sales* |
---|---|---|---|
2020 | 150 | 150 | 0.49% |
2021 | 250 | 400 | 1.2% |
2022 | 250 | 650 | 1.9% |
2023 (est.) | 589 | 1,239 | 3.6% |
2024 (est.) | 850 | 2,089 | 6.1% |
Planned Coal Plant Shutdowns Create Room for Solar Power
The ongoing expansion of utility-scale solar power enables Wisconsin electric providers to reduce their reliance on aging coal-fired generators. As these plants become more expensive to operate and maintain, utilities have initiated a generation makeover that will rely more heavily on renewable resources as well as gas-fired capacity. Output from the solar projects under development will be a key part of the resource mix, replacing the more than 2,500 MW of coal-fired capacity that will close for good in the next three years (see Table 5).
Current Coal Plant Retirement Schedule
Plant(s) | Capacity (in MW) | In-service Dates | Utility Owner(s) | Shutdown Date |
---|---|---|---|---|
South Oak Creek Units 5 + 6 | 528 | 1959, 1961 | WEPCO | 5/2024 |
South Oak Units 7 + 8 | 610 | 1965, 1967 | WEPCO | 12/2025 |
Edgewater 5 | 380 | 1985 | WPL | 6/2025 |
Columbia Units 1 + 2 | 1.023 | 1975, 1978 | WPl/WPS/MGE | 6/2026, 12/2026 |
Total | 2,541 MW |
In 2022, the South Oak Creek, Edgewater, and Columbia plants produced approximately 9.4 million MWh or 15% of the electricity sold in Wisconsin. It would require 4,700 MW of utility-scale solar capacity to generate an equivalent amount of electricity in a typical year. Between the 650 MW of solar power operating today, the 1,439 MW presently under construction, and the 1,300 MW represented by the six Class of 2023 projects, Wisconsin could have as much as 3,389 MW of operating solar generation by 2027. Should that happen, in-state solar power would account for 10% of the electricity serving Wisconsin electricity customers.
As noted in the state’s Clean Energy Plan (page 109), “[u]tility-scale renewable generation plays a disproportionately large role in decarbonization, as it is very cost-effective, helps reduce the energy burden for all customers, and reduces emissions from fossil plants …. [emphasis added].”