I’ve been following the NRDC Fellows’ EV road trip across the Midwest. They drove, they charged, and they wrote about it. This particular blog post, about the Midwest electric vehicle market, caught my eye. At first, maybe it was due to the colorful maps, but I found an underlying message for Wisconsin in this post: Keep the ball rolling.
There is so much potential for Wisconsin to be a leader in the electric vehicle market, and these statistics prove it. With hardly any pro-electric vehicle policy, Wisconsin is keeping up with states like Minnesota and Michigan. Think about what we could do if we keep the ball rolling! Recent wins like the Volkswagen Settlement Funding signal a bright future for Wisconsin’s electric vehicle market.
Enjoy!
Midwest Electric Vehicles in 5 Maps
July 02, 2019
Ada Statler Jessica Russo Madhur Boloor Patricia Valderrama Samuel Garcia
This is the sixth blog in a series about our Midwest electric vehicle adventure.
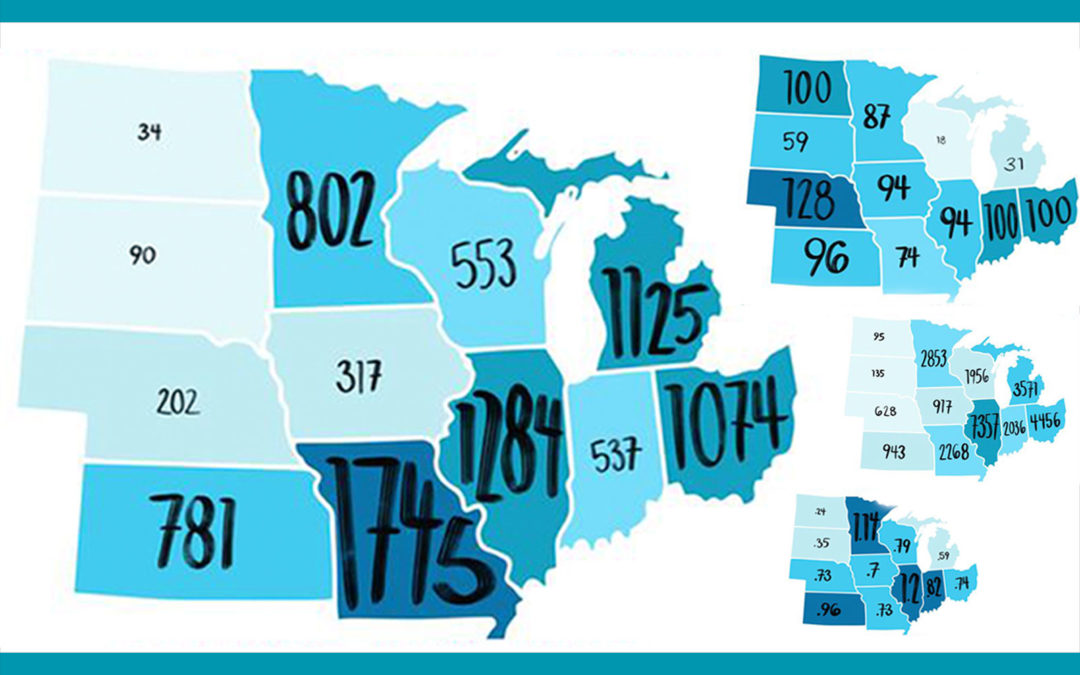
We’ve written about electric vehicle (EV) policies and pilot programs in the Midwest, as well as sub-trends we’ve seen along our 1,300+ mile electric road trip route. But it can also be helpful to see where the numbers stand overall. These maps look state by state at EV sales numbers, market shares, growth, charging infrastructure, and related jobs. Notably, the places where we’re seeing the most EV-related activity (darker blues in the map) are also generally where we’ve seen the introduction of more EV-friendly policies.
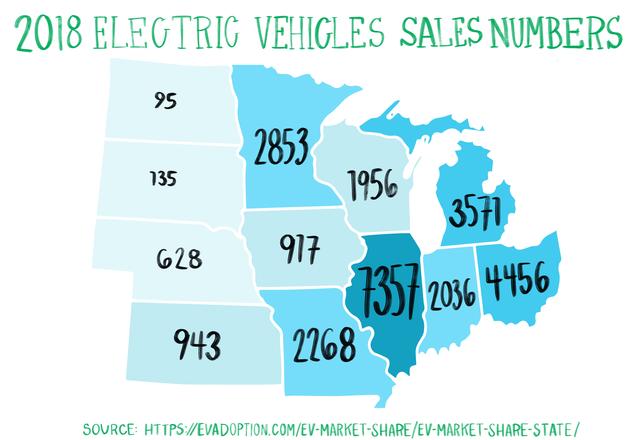
Looking at the number of new EVs bought in a state can seem like the most straightforward way to understand how many clean cars are on the road there. But without taking population and car ownership numbers overall into account, it is hard to really get a sense of where EVs are taking off and where they still need encouragement.
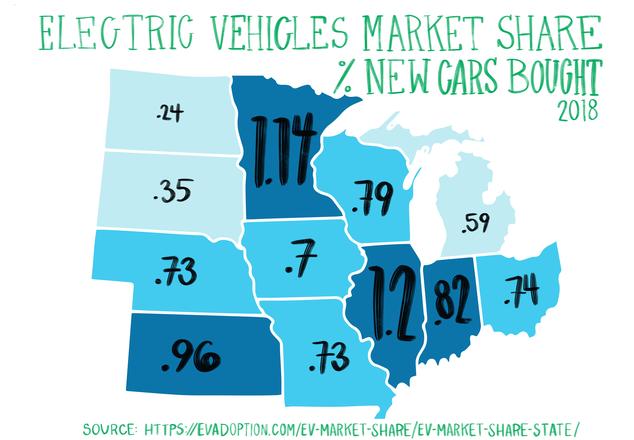
Looking at EV purchases as a percent of market share within each state is a bit more helpful as it allows you to consider how big of a presence EV sales are in the state’s market. For perspective, the highest EV penetration is in states like California, where the 7.84 percent EV market share of new vehicles bought in the state in 2018 represents 46.8% of national EV sales that year—likely due to Zero Emissions Vehicles (ZEV) Standards that require automakers to stock EVs in-state. The ZEV standard goal is 2.5 percent market share for EVs by 2025 and 8 percent market share by 2030. No Midwestern states have joined the coalition of states with ZEV standards. Nevertheless, Illinois and Minnesota lead the region with 1.2 and 1.14 percent EV market shares respectively. (It’s no coincidence that both these states also have a relatively high number of public chargers, and that Minnesota has been moving forward with utility charging programs.) Policies like ZEV standards could go a long way toward reducing barriers to EV access in this region and expanding consumer choice.
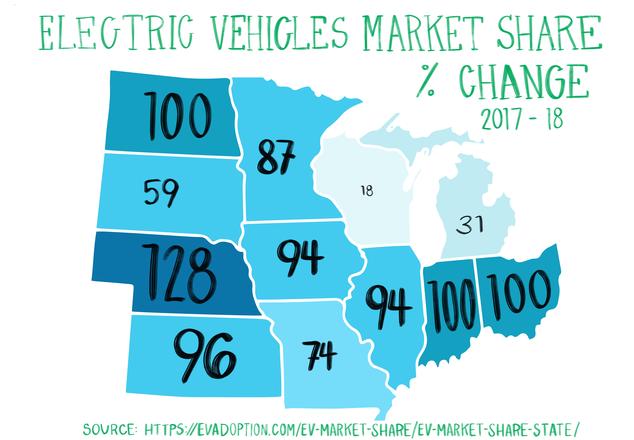
It might still be hard to get a sense of EV growth without looking at how the market share changes from year to year. The short of it: quickly! This map shows the change in EV market share over one year. Notably, some states, like Illinois, have grown faster (as a percent change) in the past, while others, like Nebraska, are just starting to see more growth and thus appear to have greater growth.
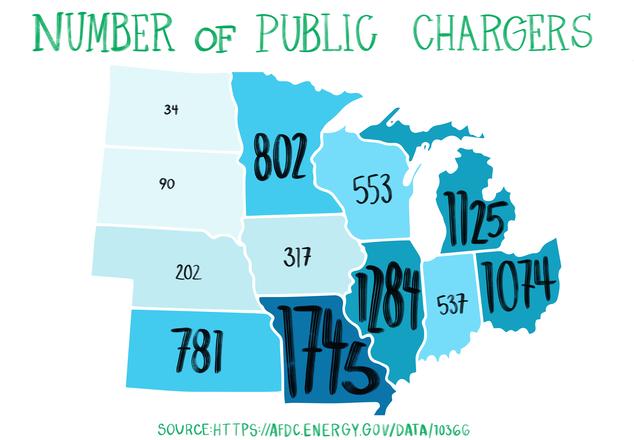
Increasing the number of public charging stations is essential in order to enable longer-distance travel in electric vehicles and ownership options for roadtrippers, and for those who may not be able to charge an EV at home. This data source looks at number of plugs as opposed to stations because there may be anywhere from one to eight plugs at a single charging station. Both the total plug count and the total station count are important: we don’t want any EVs to have to wait in line to charge, but we also want to make sure that stations have a useful geographic spread.
It’s important to note that these ports are not evenly distributed throughout the state. Most are concentrated in larger cities, with a few along major highways. In our experience, there are certainly spots where more could be useful. For instance, even in Missouri, which has the largest number of absolute charging ports in the region, it would have been very difficult for us to travel in our Chevy Bolt (a longer range non-Tesla EV) between the state’s two largest cities, St. Louis and Kansas City. This is just one example of the need for more strategically distributed chargers.
Thanks to the NRDC team for allowing us to share their blog. Check out other blogs from the NRDC Fellows Road Trip here.